
matplotlib 를 쓰다 보면 figure의 안에 있는 그림만 저장하고 싶을 때가 있다. 일반적으로 figure를 그냥 출력하면 아래와 같다.
import matplotlib.pyplot as plt

fig, ax = plt.subplots()
ax.plot(range(10))

for item in [fig, ax]:
    item.patch.set_visible(False)

fig.savefig("output4.png", bbox_inches="tight", pad_inches = 0)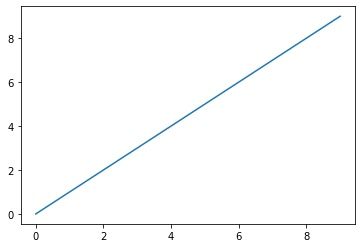
일반적으로는 여기서 axis('off) 옵션을 주어서 x, y축을 지우고 출력하면 된다.
fig, ax = plt.subplots()
ax.plot(range(10))

fig.patch.set_visible(False)
ax.axis('off')
fig.savefig("output4.png", bbox_inches="tight", pad_inches = 0)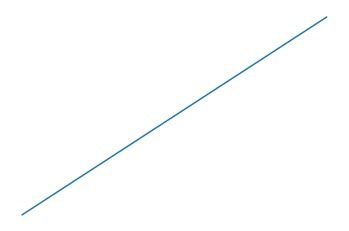
하지만 이 경우, 축이 차지하고 있던 공간은 사라졌지만 원래 축 바깥에 있던 margin은 그대로 있기 때문에 그림을 저장해보면 그래프에 테두리가 생기게 된다. 따라서 frameon=False 옵션을 처음에 figure를 만들 때 설정해주면 해당 마진이 사라지게 된다.
fig = plt.figure(frameon=False)
ax = fig.add_axes([0, 0, 1, 1])
ax.axis('off')
ax.plot(range(10))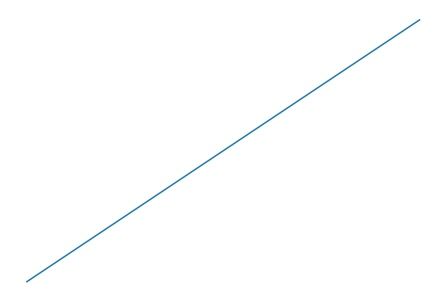
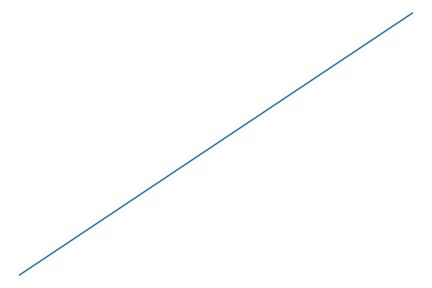
마지막으로 plt.savefig 함수에서 그래프 주위에 기본적으로 boundary를 주게 되는데 이것도 아래 옵션을 사용하면 완벽히 제거할 수 있다.
fig.savefig("output4.png", bbox_inches="tight", pad_inches = 0)